Share
Main Conclusions
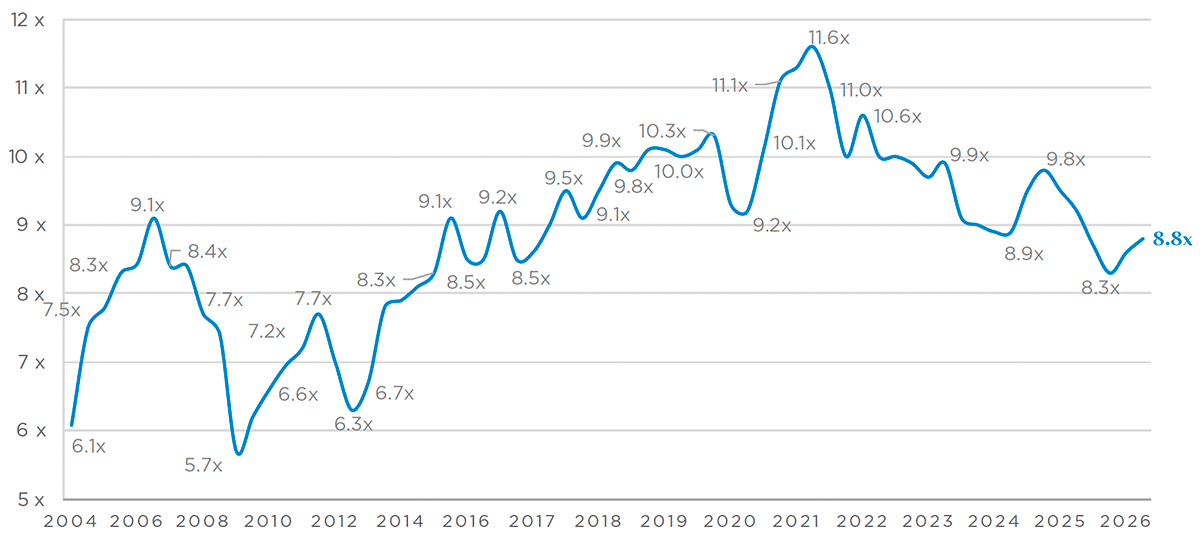
- 1. The Argos Index® confirms its slight rebound to 8.8x EBITDA in Q2 2026.
- 2. This increase is broad-based across both buyer groups and market segments.
- 3. The share of deals priced below 7.0x EBITDA rose to 27%, and those above 15x continued to decline to 5%, reflecting diverging pressure across sectors.
- 4. Mid-market M&A activity decreases in Q2 2026, as volume momentum fades.
- 5. The strengthening in PE fund multiples, driven by selective deployment on premium assets, still contrasts with stable multiples paid by strategic buyers.
The Argos Index® confirms its slight rebound
to 8.8x EBITDA in Q2 2026
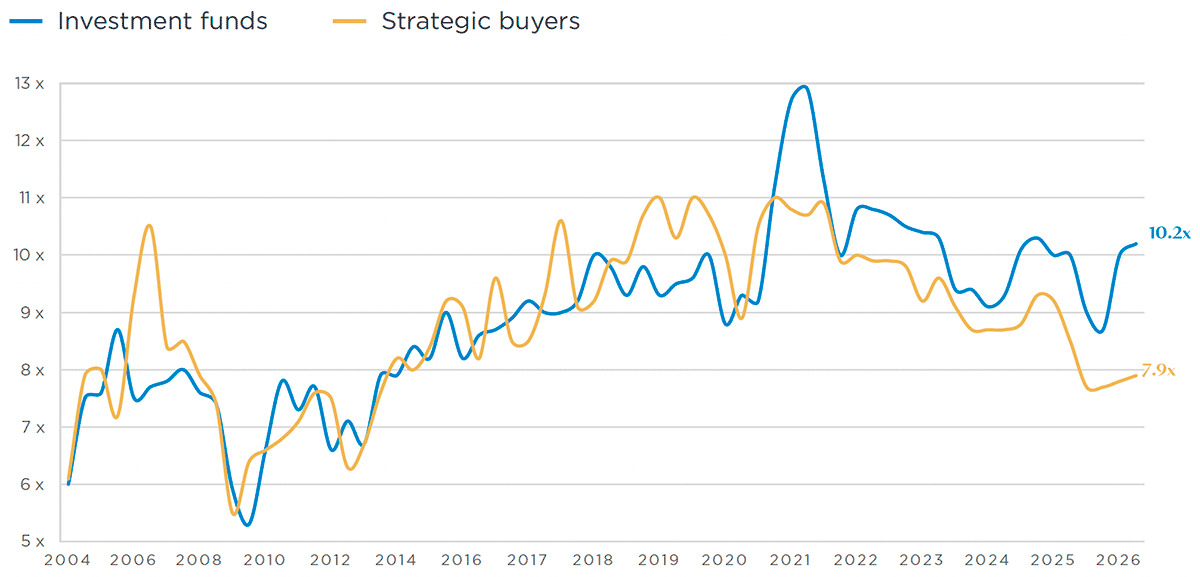
The Argos Index® rose 2.3% to 8.8x EBITDA. The price rebound that began in Q1 2026 was confirmed in Q2, although gradually, across both buyer types and market segments. Investment fund median multiples rose to 10.2x EBITDA and strategic buyer multiples to 7.9x. By size segment, the upper mid-market (€150–500m) drove the increase, while the lower mid-market (€15–150m) held broadly stable.
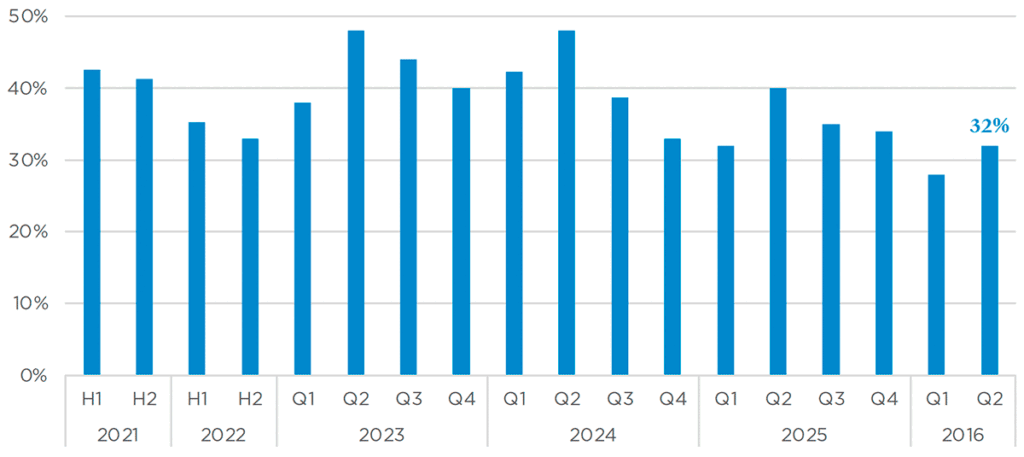
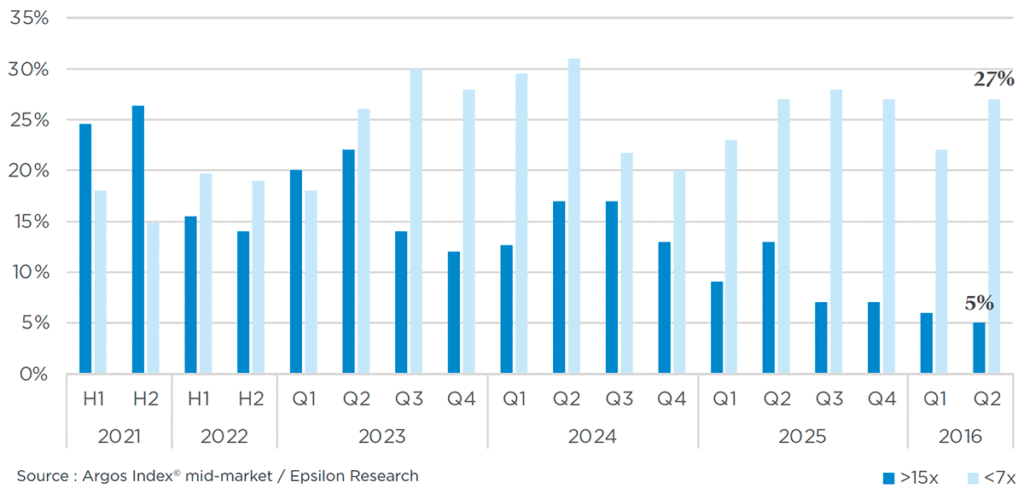
The share of transactions above 15.0x EBITDA continued to decline, to 5% from 6% in Q1, remaining at a historical low, while the share below 7.0x EBITDA rose to 27%, from 22%. This highlights downward pressure on prices and the fragility of the rebound, but also diverging sector-level dynamics: emerging pressure on some traditionally high-multiple sectors such as software (whose SAAS model is threatened by IA), alongside a normalisation in lower-growth sectors, where sellers have adjusted their price expectations.
Prices strengthened despite a volatile geopolitical and macro-economic environment. Mid-market M&A activity lost momentum in Q2 2026: estimated deal volume fell 8% quarter-on-quarter, with year-on-year growth decelerating to 5% from around 30% in Q1, reflecting Europe’s exposure to the Iran conflict, oil price spike, and resulting inflation risk. Long-term eurozone rates rose over the quarter(1) at a pace similar to Q1, leaving rates at an elevated level.
The Index recovery despite this backdrop reflects Eurozone’s mid-market structural resilience, as sponsors and corporates increasingly target the region’s fragmentation, need for local expertise, and lower entry multiples than North America, while sponsors remain under pressure to deploy dry powder regardless of the rate backdrop. Whether this pricing rebound persists into H2 2026 will depend on the resolution of current geopolitical tensions and the evolution of the macro-financial environment, including the ECB’s policy stance following its June rate increase.
(1) The 10y EU bond yields, calculated by the ECB, rose ~13bp in Q2 2026 (from 3.34% to 3.45-3.47%)
Argos Index® mid-market
Median EV/EBITDA multiple on a six-month rolling basis
Source : Argos Index© mid-market / Epsilon Research
The Argos Index® rebound is driven by both investment funds and strategic buyers, despite the gap in multiples paid
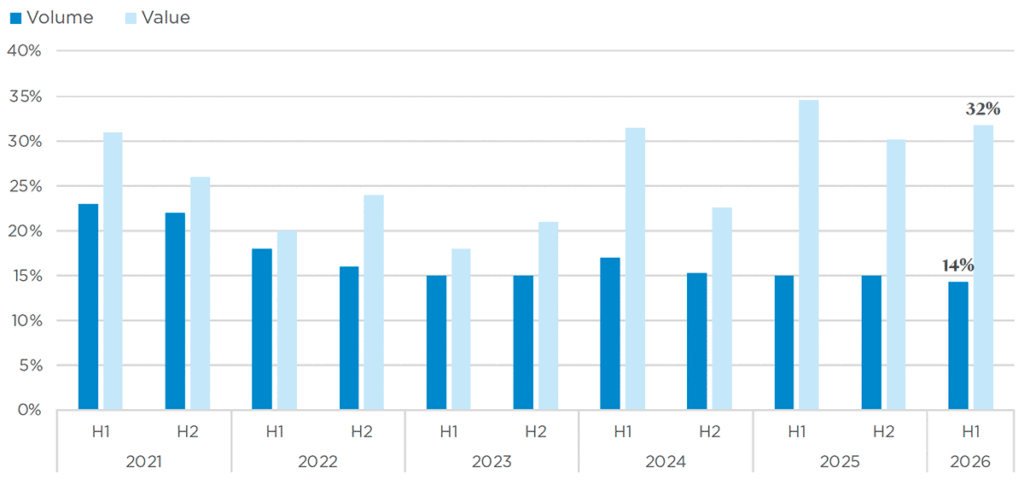
Multiples paid by investment funds rose further to 10.2x EBITDA in Q2 2026, extending the rebound that began after a low of 8.3x in Q4 2025. Strategic buyer multiples also increased to 7.9x from 7.8x, keeping corporate pricing broadly disciplined. As a result, the gap between fund and strategic buyer multiples widened slightly to 2.3x, continuing the divergence observed since the start of the year.The continued strength in fund multiples, despite a further increase in long-term eurozone rates, is linked to the sustained pressure on sponsors to deploy dry powder, still at elevated levels, combined with a composition effect: buyout activity remains concentrated in a narrower set of higher-quality transactions rather than broad-based buying. This concentration is seen in the wider LBO data for H1 2026, where funds accounted for only 14% of estimated mid-market deal volume but 32% of disclosed deal value.
The fund-strategic gap also owes to sector selection: 58% of fund-led deals in the H1 2026 sample were in higher-multiple sectors (software, healthcare, IT, B2B services), against 35% for strategic buyers, who acquired across a wider range of sectors and price points. Funds also paid more than strategics within the same sector grouping, as they typically target the sector leader or consolidator rather than a broader cross-section of assets.
Strategic buyers, by contrast, continued to pay stable multiples in Q2, little changed from Q1 and well below fund levels. This held despite a firmer public equity backdrop, with the Euro Stoxx TMI Small index up 7.9% over the quarter(1), a rally that should lift the valuation references corporates use for acquisitions, but has not yet fed through into higher strategic buyer multiples.
(1) The EURO STOXX TMI Small Index increased 7.9% in Q2 2026 and 5.1% since 1st Jan. 2026.
Enterprise value / historical EBITDA
Source : Argos Index© mid-market / Epsilon Research
Diverging evolution of the extremes of the distribution
The share of transactions priced at extreme multiples rose to 32% of the Q2 2026 sample from 28%, driven entirely by the low end of the distribution. The share above 15.0x EBITDA continued to decline, to 5% from 6% in Q1, remaining at a historical low.
Share of transactions at extreme multiples (15x EBITDA)
Source : Argos Index© mid-market / Epsilon Research
Share of transactions at multiples >15x EBITDA Argos Index® sample
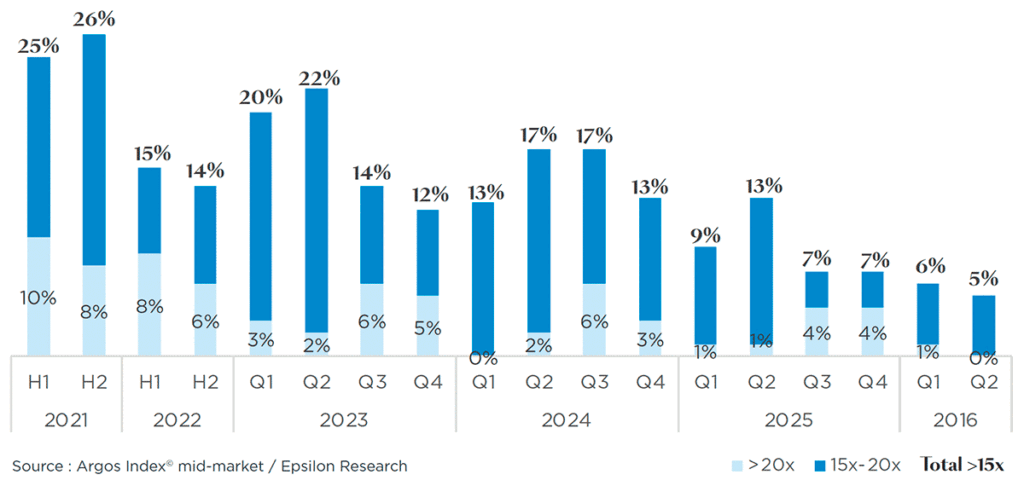
Source : Argos Index© mid-market / Epsilon Research
The share of deals priced below 7.0x EBITDA rose to 27%, from 22% in Q1, a striking difference with the low share of deals priced above 15x EBITDA. This reflects downward pressure on prices, but diverging across sectors: downward pricing on traditionally high-multiple sectors, alongside a normalisation in lower-growth sectors.
Share of transactions at multiples 15x EBITDA Argos Index® sample
Mid-market M&A activity decreases in Q2 2026, as volume momentum fades
Eurozone mid-market deal activity softened further in Q2 2026, with estimated deal volume down 8% quarter-on-quarter, extending Q1’s pullback. Q2 volumes were up only 5% versus Q2 2025, a sharp deceleration from the roughly 30% year-on-year growth still visible in Q1. Both the lower and upper mid-market segments fell in lockstep (8% each), with disclosed values pointing the same direction. On a half-year basis, H1 2026 deal volume was up 11% year-on-year but down 16% versus H2 2025, indicating a loss of momentum relative to last year’s peak. Disclosed value fell by close to a quarter on both bases.
This loss of momentum reflects Europe’s exposure to the Iran conflict, associated oil price spike above $100/barrel, resulting inflation risk, and impact on the expected growth rate. ECB’s interest rate increase in June was too late in the quarter to explain the slowdown. The contrast is only apparent with the broader M&A trends in H1 2026: global M&A value rose 49% to $2.8tn and European M&A value rose 105% year-on-year(1), but volumes declined significantly, down 14.2% in Europe.
(1) Source: LSEG / Financial Times, 01.07.2026
Eurozone mid-market activity (€15–500m) in volume (# deals) and value
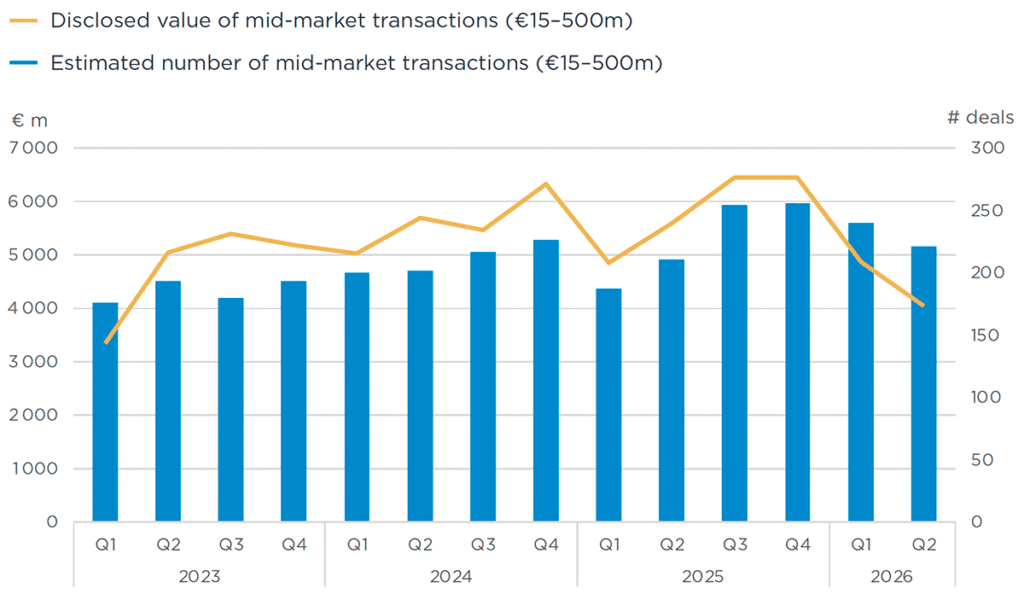
Source : Argos Index© mid-market / Epsilon Research
Eurozone mid-market activity (€15–500m) in volume (# deals) and value Source: Epsilon Research / MarketIQ
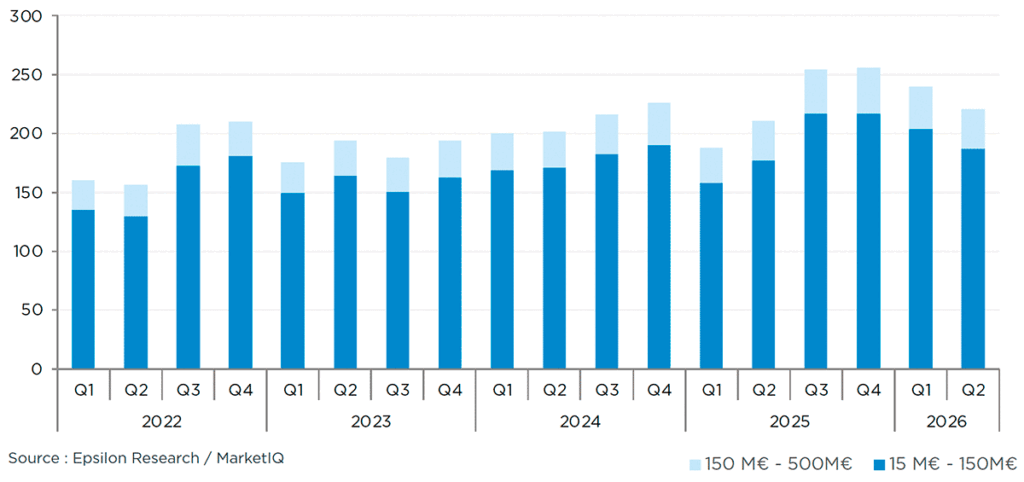
Investment fund volume activity in the mid-market rose 11% year-on-year in H1 2026, but declined 16% relative to the H2 2025 level, with exits following a similar half-year pattern. The LBO share(1) of mid-market M&A remained stable at 14% in deal count, while their share of deal value remained higher, at 32%. This confirms the re-engagement of sponsors in primary buyouts, but concentrated in a smaller number of larger transactions rather than distributed across the broader deal population.
(1) Does not include build-ups
Share of LBO in Eurozone Mid-market M&A